Data management option & automatic analysis option
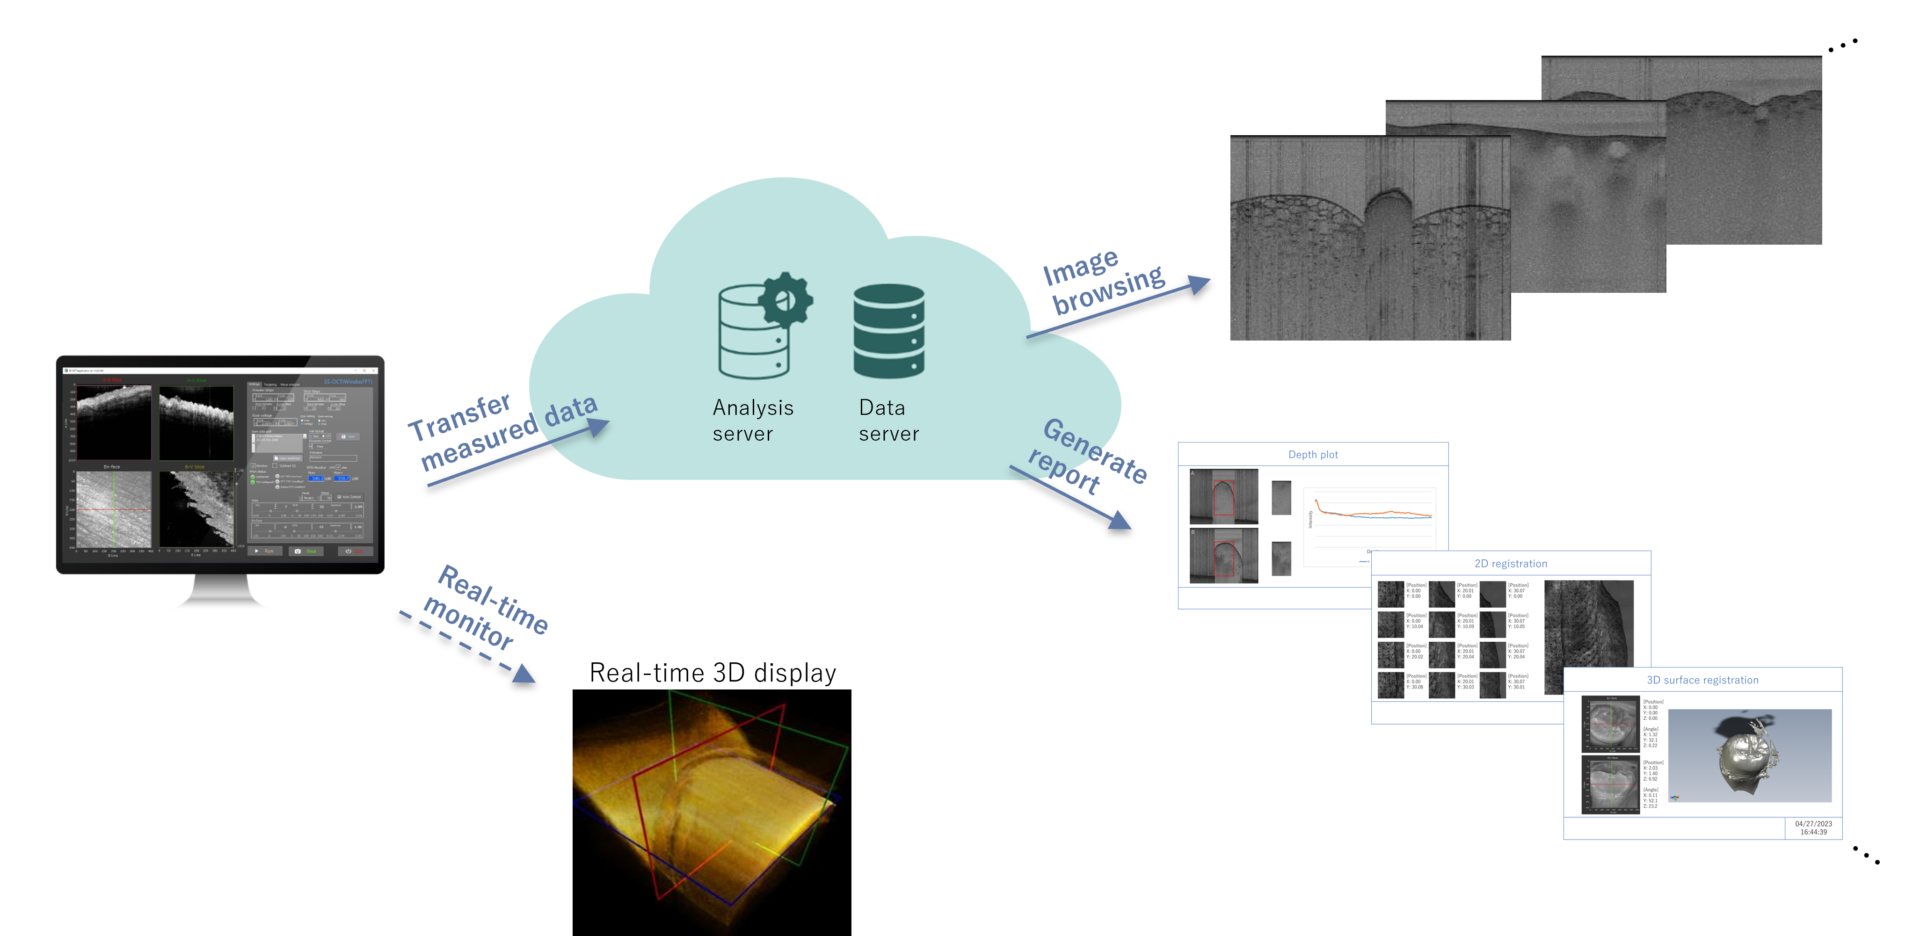
OCT often involves a large number of measurements to achieve objectives. Post-processing to generate images of optimal quality from this large amount of measurement data is time-consuming.
When measurement data is transferred to the data management server, post-processing is automatically performed sequentially, so the user is not bound during post-processing and can view all images generated after all processing is complete.
In addition, it is possible to automatically generate reports with easy-to-read image alignment and to automatically generate reports of the results with post-processing software options.
An example of an auto-generated report is shown below.
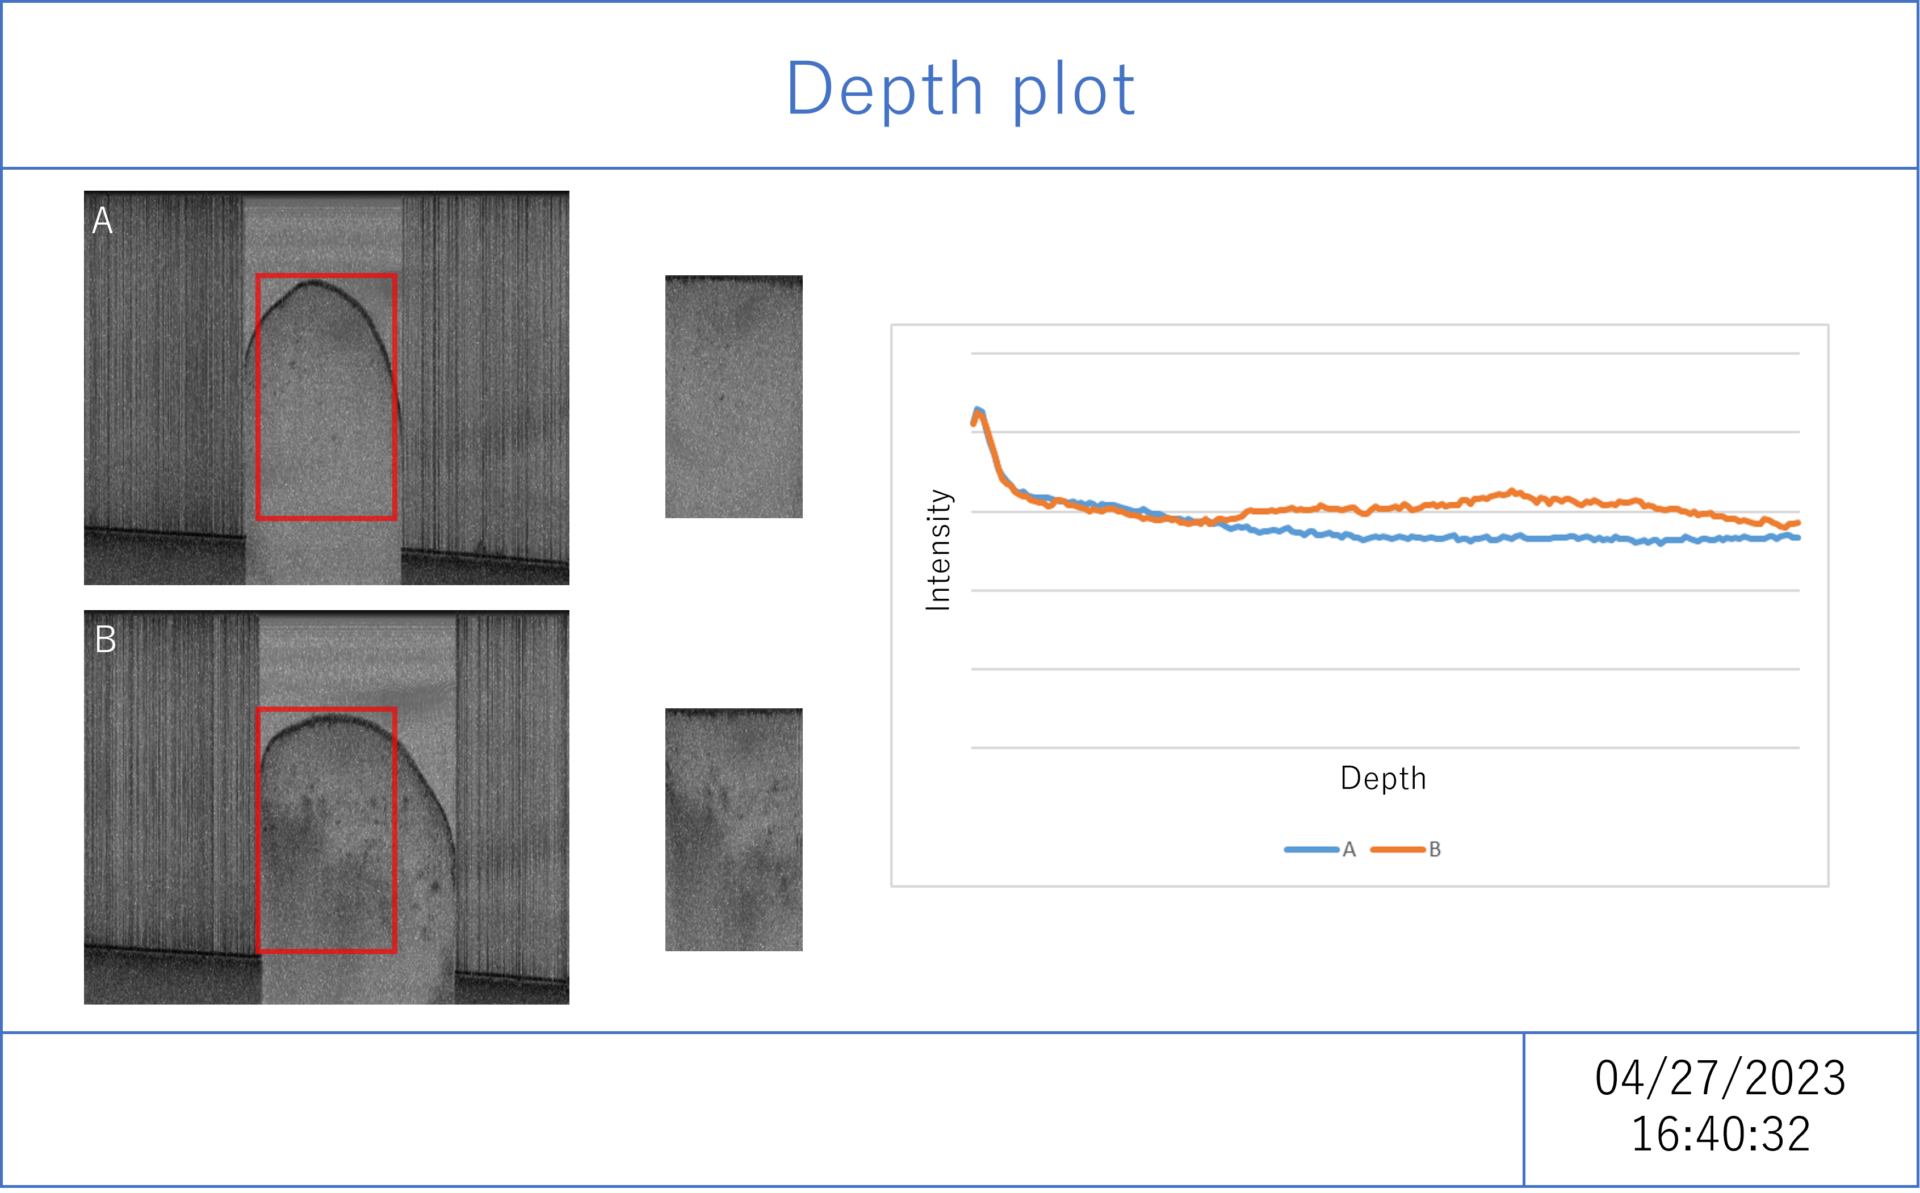
Example of auto-generated report: Depth plot
The following is a report of plots and images used in the analysis. A red square shows the area used for analysis, and a surface-aligned image is also displayed for qualitative review.
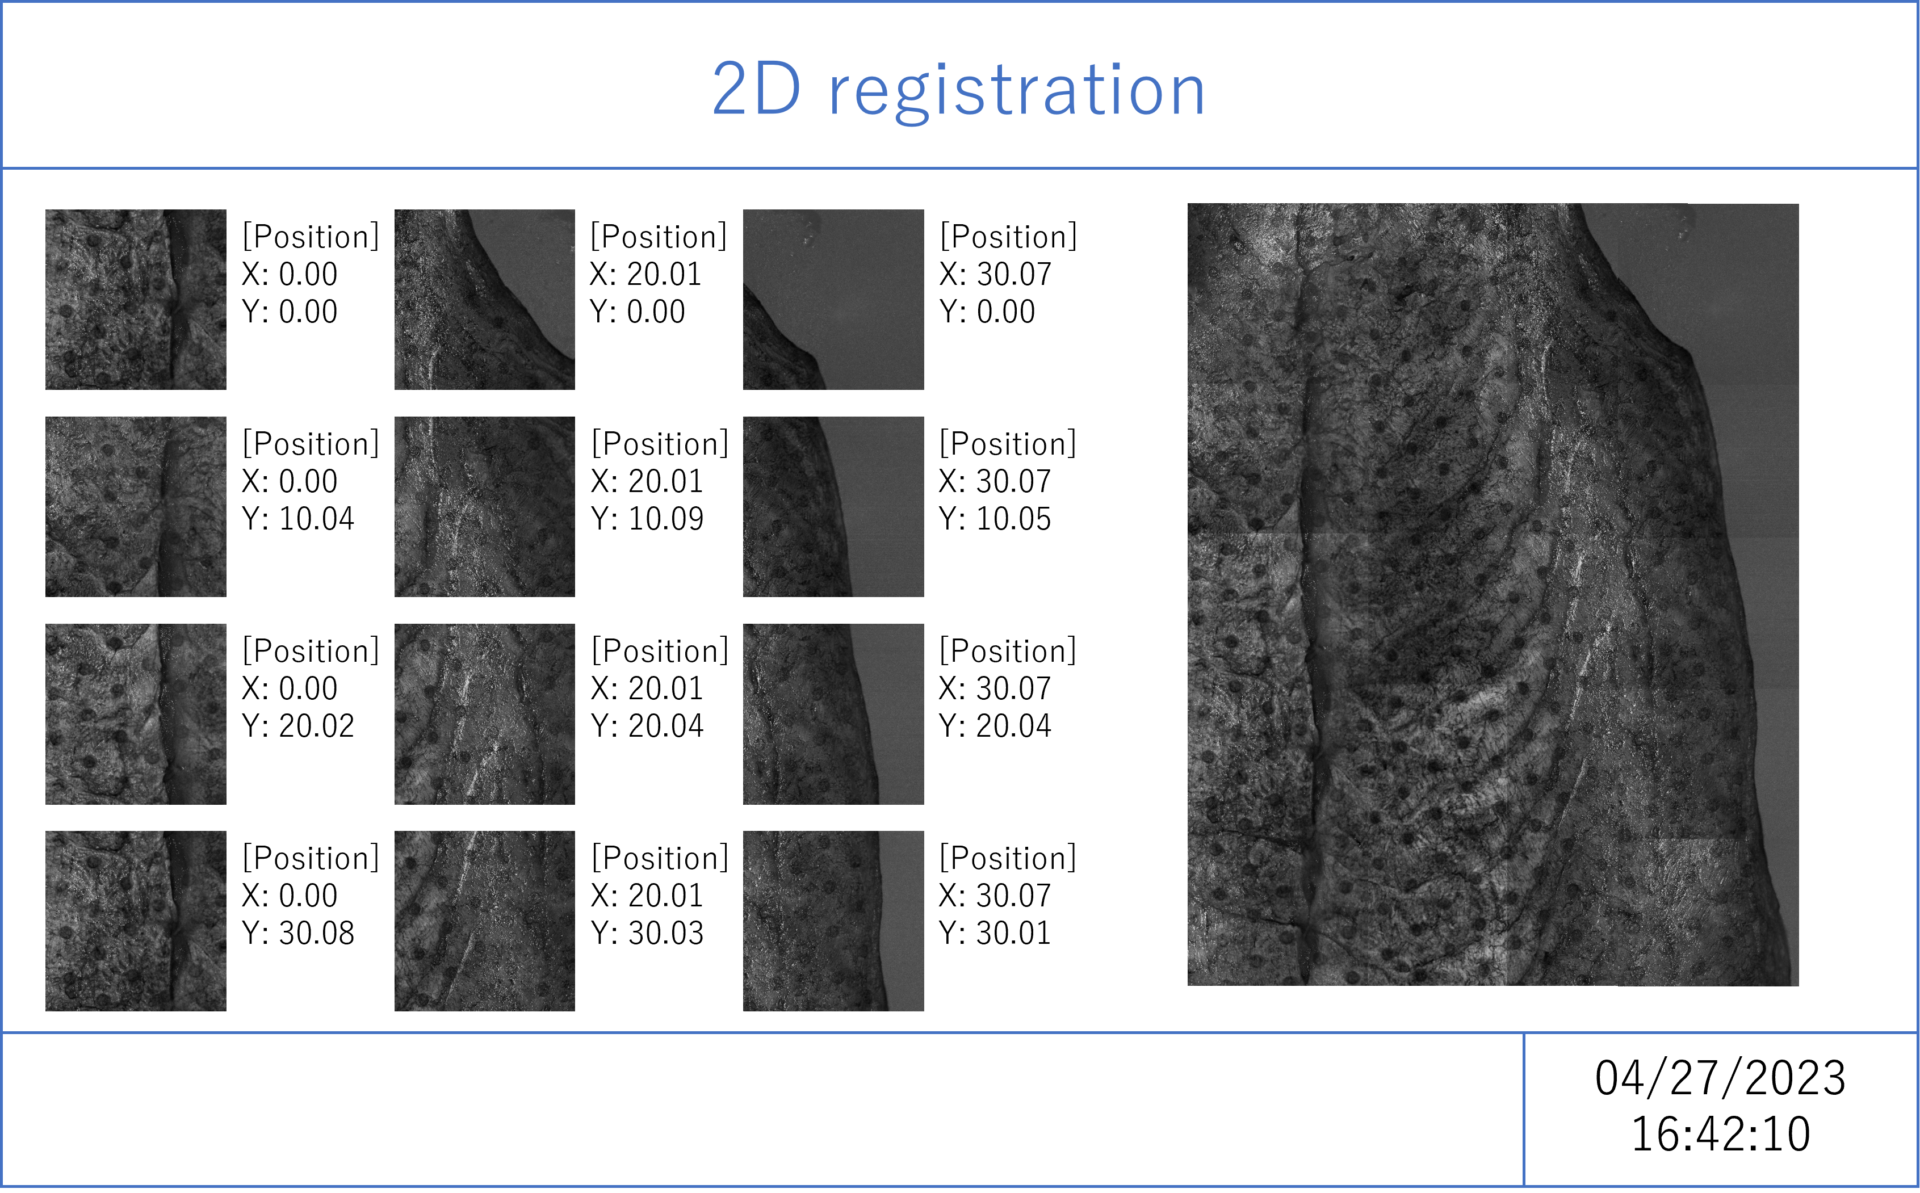
Example of auto-generated report: 2D registration
The following is a report of images used for registration, the registration result, and the respective positions of the images.
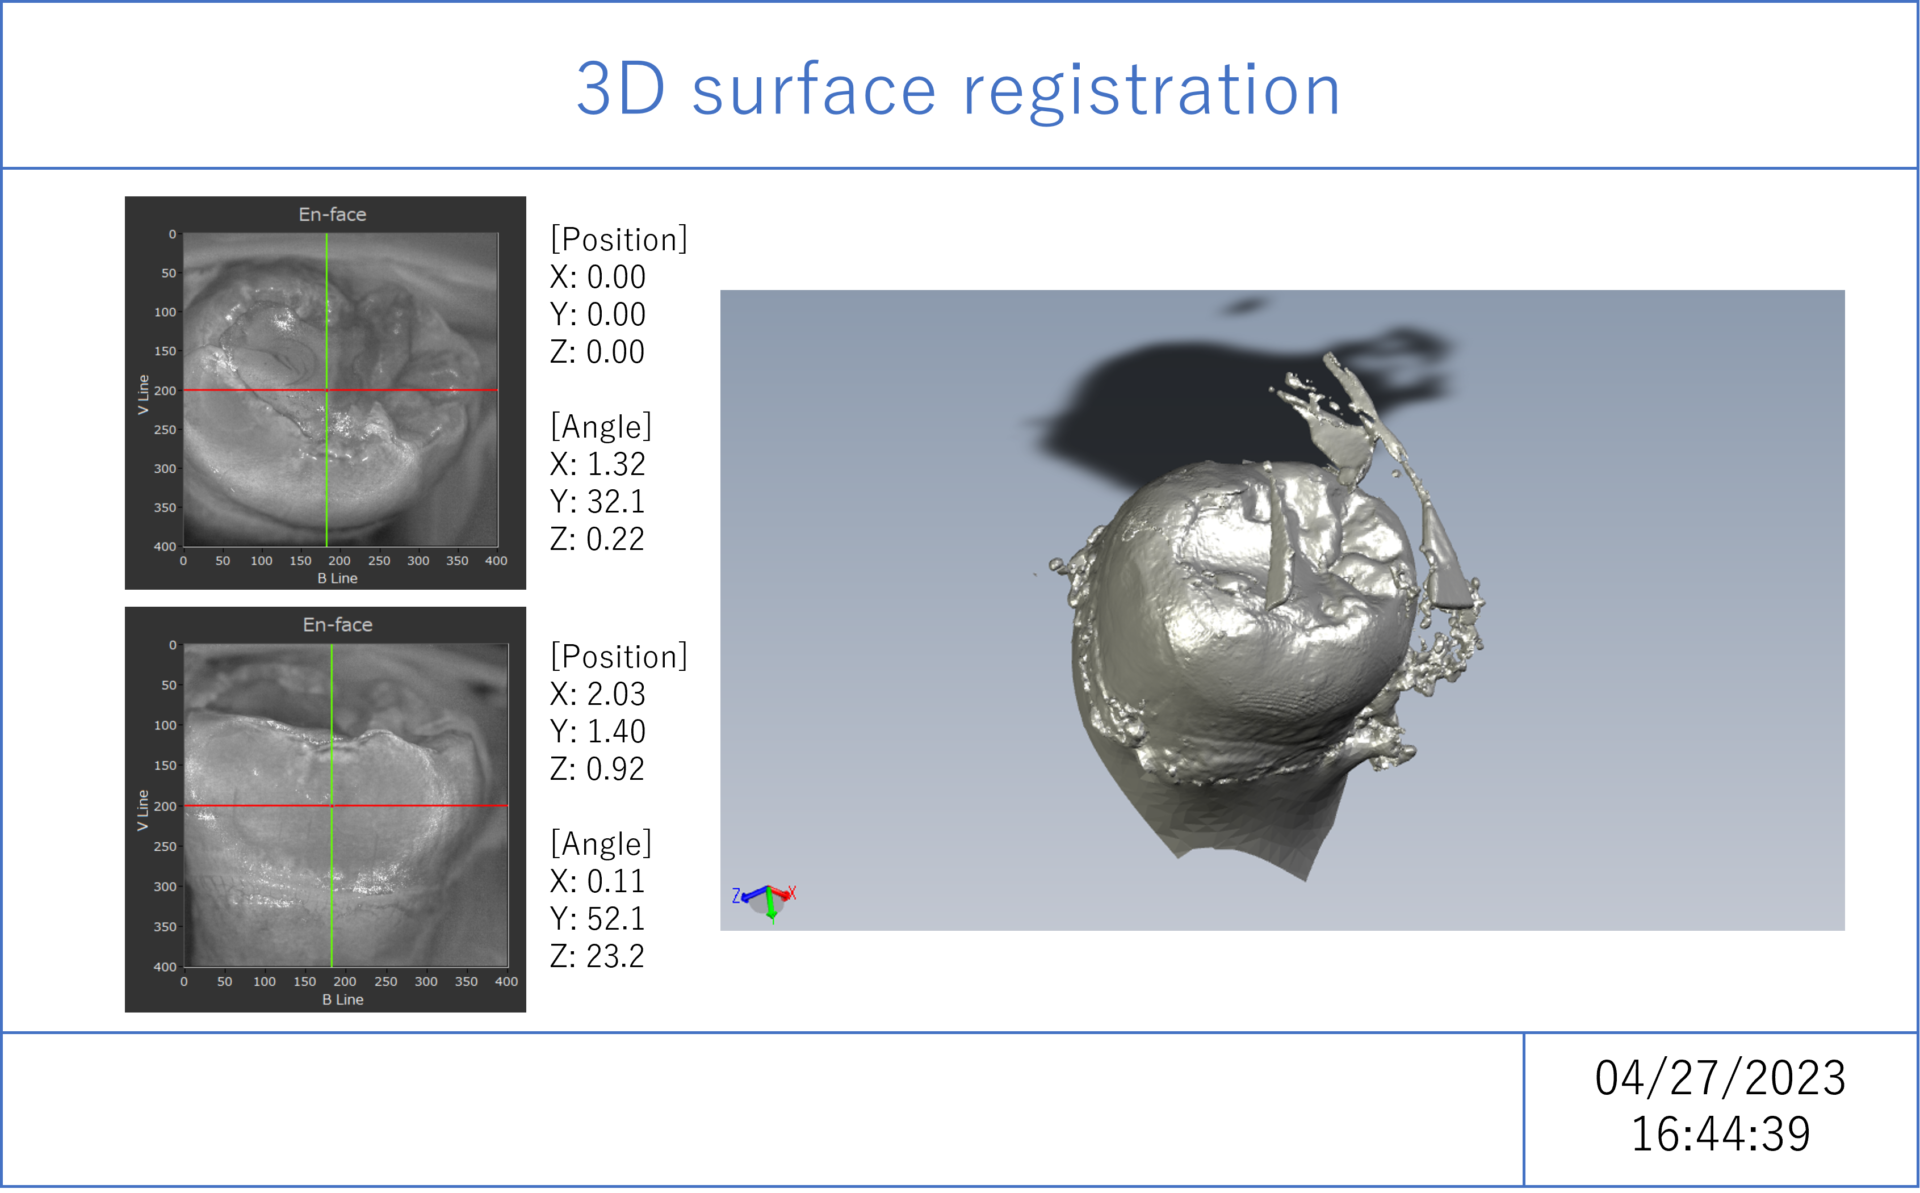
Example of auto-generated report: 3D surface registration
The following is a report of images used for registration, the registration result, and the respective positions and angles of the images.
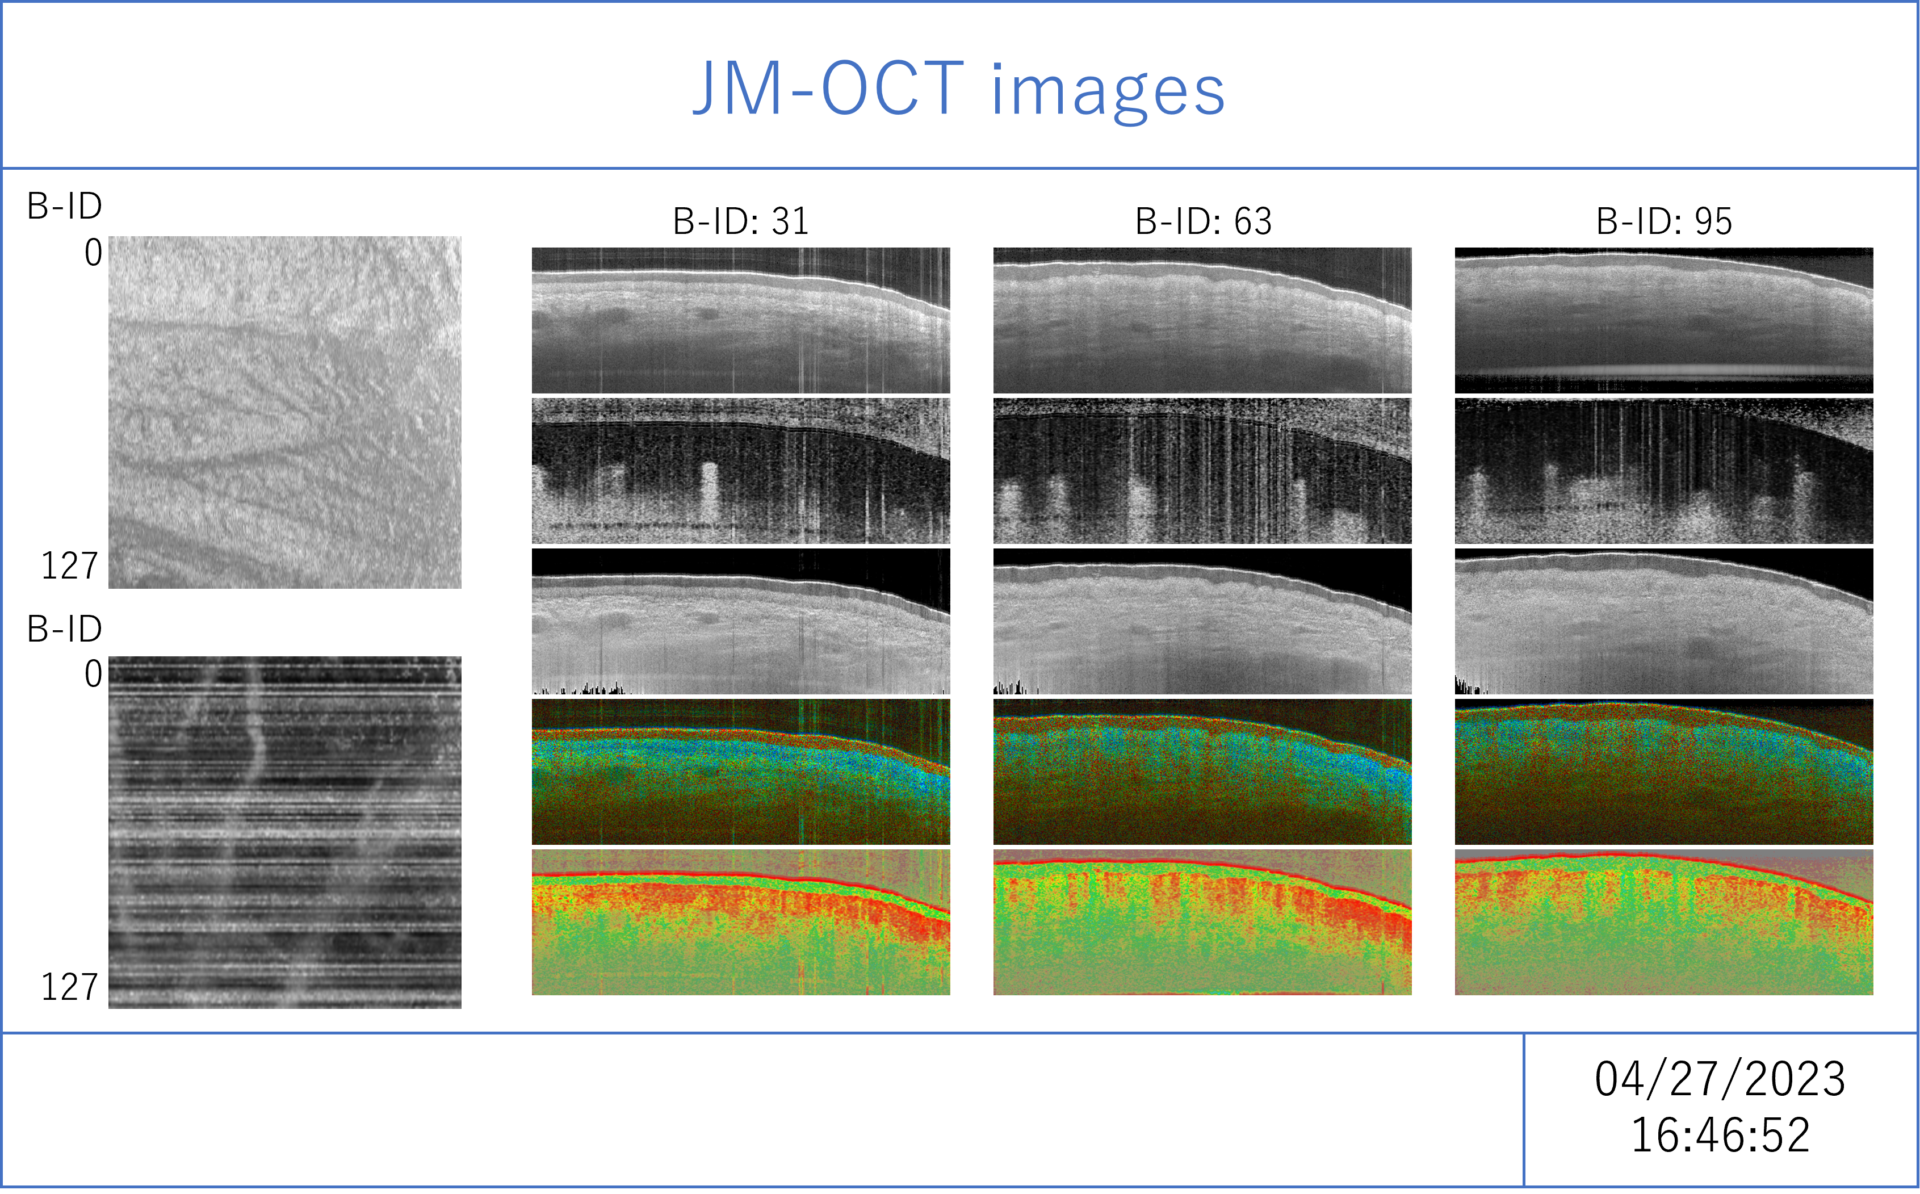
Example of auto-generated report: list of JM-OCT images
There are many contrasts in JM-OCT, and opening and checking each file one by one can be a daunting task. By checking the list of each contrast for several positions (automatically generated), you can quickly get an overview of the measurement results.
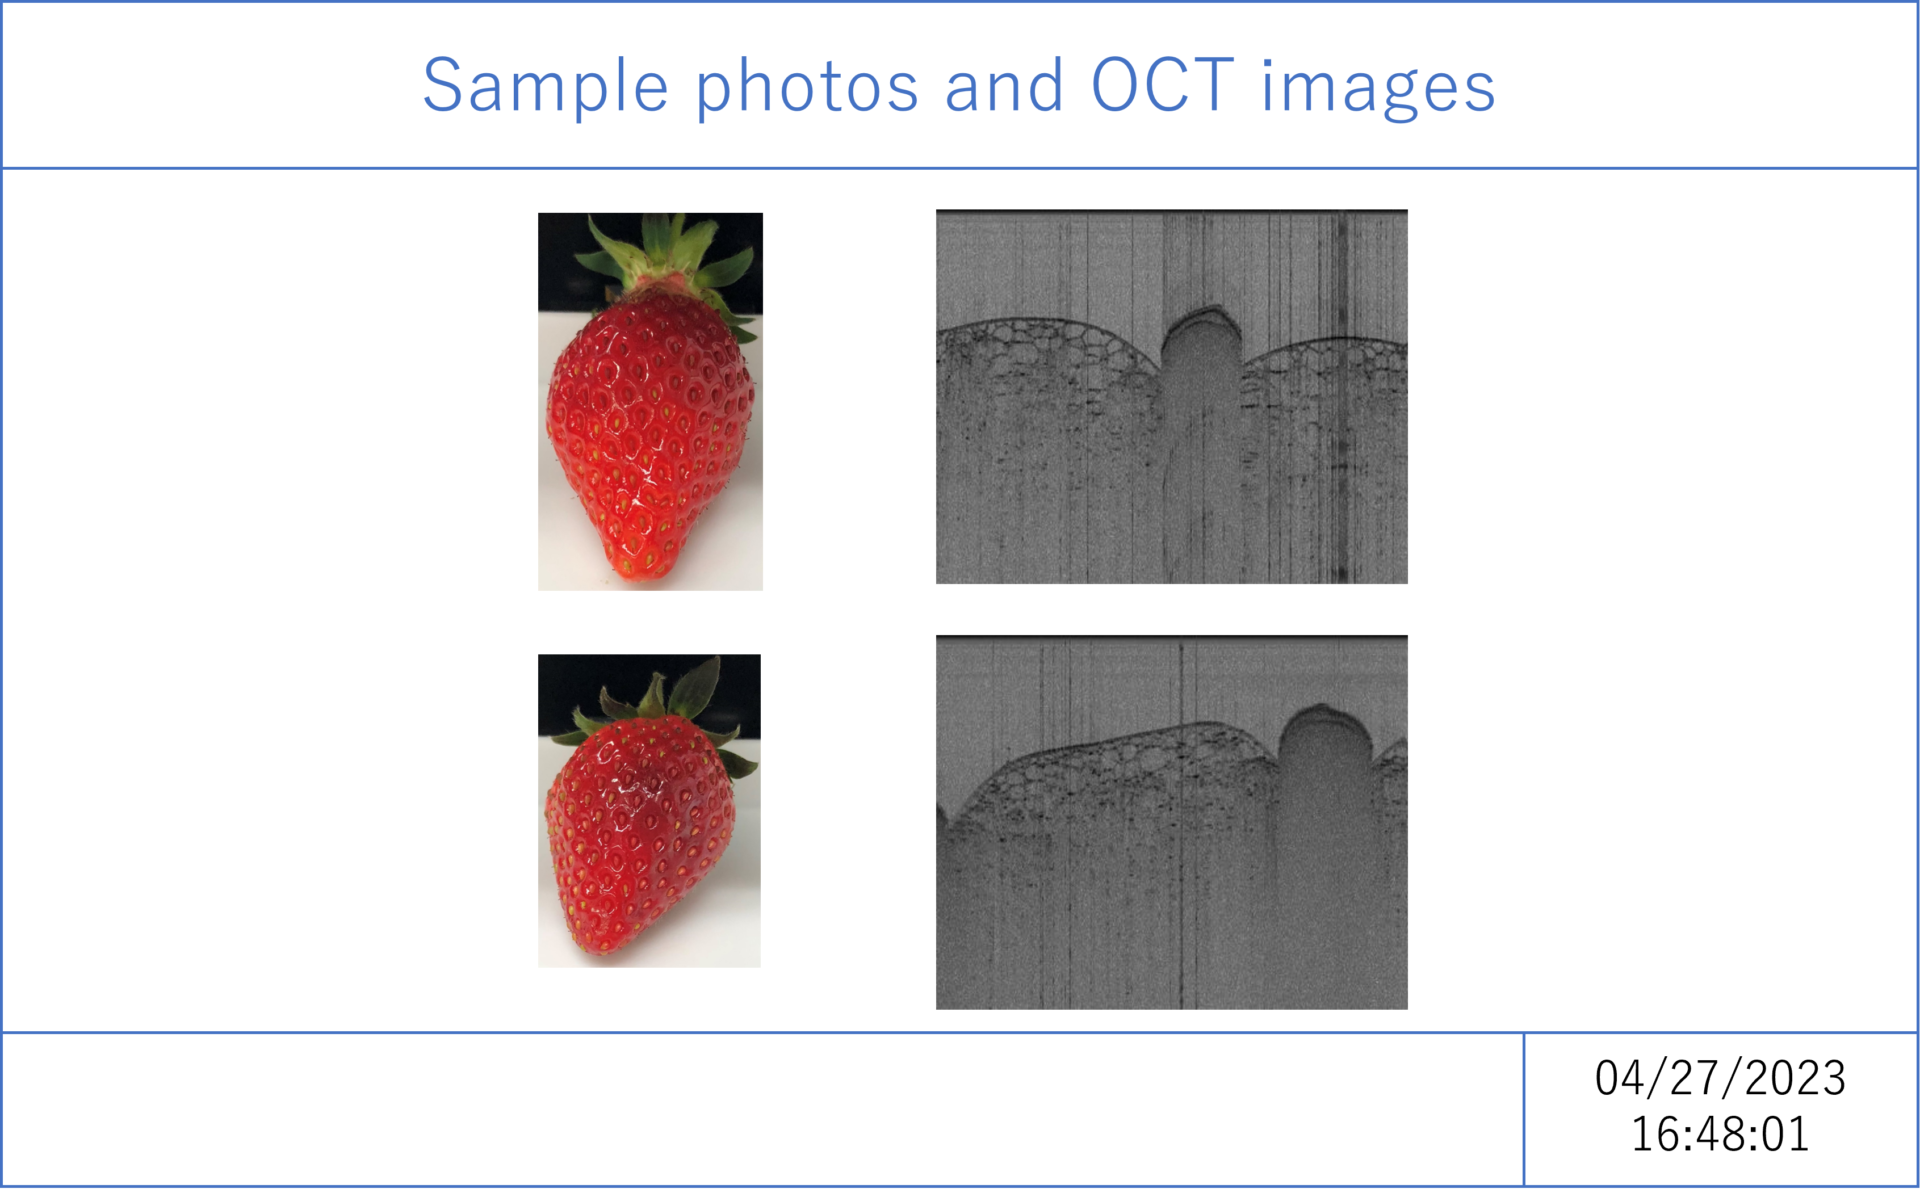
Example of auto-generated report: list of sample photos and OCT images
This is a side-by-side list of sample photos (taken separately from the OCT) and the OCT image.
In the strawberry example, the OCT image shows that the cells near the surface are crushed in the areas that have lost water, as can be seen in the photo.
Data management server option top
Post-processing software options
